Stock Market Appreciation – I Am Going To Be Rich!
In my last blog, I discussed the three reasons that people own stocks. We looked at the first reason which was in order to receive a stream of income in terms of a dividend. This alone certainly did not make a lot of sense since it was less than half of what you could make with bonds. Another reason for holding stock was to take over a company and direct it. I don’t think many of us our in the market for that reason. That leaves the last one which is we are in the market because we hope to buy and sell our stocks we own for a profit.
In a lot of articles you read about the stock market as an investment they talk about how you need to own stocks because of it’s annualized rate of return. The number is usually somewhere between 7 – 10% depending on what years they choose to do this for. Over the last 100 years it has been 9.53%. The last 50 years it has been not much different at 9.56%. The last 25 years it was been an outstanding 10.8%. So, it looks like you better get started investing and getting rich! Let’s look at the last decade or so to make sure. The return since 2000 was -30%.
So, what does this mean? It means that stocks really aren’t something you get a true annualized rate of return like a bond or savings account. It means sometimes it goes up and sometimes it goes down. Again, the stock market is an auction and people primarily must buy stocks because they want to sell them for more than they bought them for. So, in the last 10 years has something fundamentally changed? Are the companies the stock is for not as valuable as they were 10 years ago?
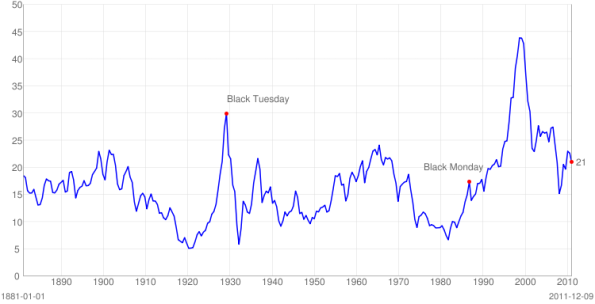
As you saw in the last blog dividend yields were even lower 10 years ago than they are today, so from the point of view that a stock is only worth the future income it may generate then they shouldn’t be worth any less than they were 10 years ago. Discounting the dividend growth in terms of a rate of return is only part of the story. You really need to look at the earnings of a company. In general, a company makes money (hopefully) and then determines to either reinvest the earnings or pay them out as dividends. Theoretically, reinvesting earnings will result in more earnings which could be paid out in the fashion of future dividends. So, how have earnings been doing and how do the correlate with the stock market going up or down? The equivalent to Dividend Yield (total dividends / stock price) for earnings is the Price to Earnings Ratio.
Since the Price to Earning Ratio was bout 21 that means that the rate of return in terms of earnings is 100/21 or about 5% which puts on par with Bond Yields. So, the dividend yield as a drive from the last blog could be amended to be the “Earnings Yield” for an investor. So, why is the market so choppy? We earlier discussed that dividends did not seem to vary much, but, stock price did. What about earnings? Well it turns out that earnings do change over time. Most companies will try and protect their dividends, but, earnings come and go depending on both the performance of the company, as well as, the state of the overall economy. As you can see a couple of big peaks set expectations so high that they couldn’t possibly be met and ended in huge adjustments meaning falling markets.
If you look at the economy as a whole, Gross Domestic Product is a measure of how well it is doing. The higher the GDP the higher the potential is for earnings. So, in recessions earnings drop. When earnings drop stock prices normally follow as companies can’t pare down expenses as fast as demand is dropping. Over the last 10 years GDP has been growing, but, slower than normal (1.75%). So a classical way of looking at this is that a company is worth the normal earnings it has plus the anticipated growth. Using GDP as a proxy for growth rate for all stocks then you could say that the average stock is worth the normal earnings (5%) + a forecast for GDP (say 2%). This would mean maybe somewhere around 7% which is a little lower than it has historically been. So, the stock market growth should have been 7% minus the dividend yield of 2% or about 5% per year over the last decade. So, the pure financial reasons for owning stock don’t explain the “lost decade” of growth.
So, if the math doesn’t drive the stock market what does? I will speculate on that in the next blog.

